The accuracy of PM2.5 sensors depends heavily on the measurement method used. While the beta-ray and micro-oscillating balance methods are well-established and widely accepted, the light scattering method is less commonly used. This is mainly because it is sensitive to environmental factors, which may lead to inaccuracies. This study focuses on the PMS3003 laser sensor, comparing its measurements to those of a benchmark device. The analysis shows a linear correlation between the two, influenced by humidity. By adjusting for the impact of humidity, the measured values align more closely with standard values, reducing errors and enhancing the accuracy of the light scattering method.
Particulate matter (PM) refers to solid particles or liquid droplets suspended in the air, contributing significantly to air pollution. Particulate matter with an aerodynamic diameter of 2.5 microns or smaller is classified as fine particulate matter (PM2.5). The primary methods for measuring PM2.5 are the gravimetric method, micro-oscillating balance method, beta-ray method, and light scattering method.
This method is independent of the shape, size, or color of the particles. Under optimal conditions with precise equipment, it is the most reliable measurement technique. However, the process is cumbersome and time-consuming. The sampler is cumbersome to transport, noisy, and unable to provide immediate results, which prevents real-time monitoring.
TEOM is an established online technology widely used for measuring particle concentration. Due to its strong correlation with the gravimetric method, it is widely adopted. The FDMS membrane dynamic measurement system recovers particles volatilized during sampling on the filter membrane, ensuring accurate particle concentration measurement. TEOM+FDMS technology is validated as the most accurate federal equivalent method for PM2.5 monitoring and is recognized by the U.S. Environmental Protection Agency. The TEOM method is recommended by China’s Ministry of Environmental Protection for automatic PM2.5 mass concentration monitoring.
Particulate matter concentration is measured using the beta-ray attenuation method. The equipment consists of a beta-ray source and a sensitive detector. The beta-ray source emits high-energy electrons (beta-rays), which pass through the sample filter and are detected by the detector. As particulate matter concentration increases, the number of beta rays passing through the filter decreases. The mass concentration of particulate matter on the filter and the air volume collected can be calculated using a formula that relates beta-ray attenuation to particulate matter mass concentration. This method is also recommended by China’s Ministry of Environmental Protection for automatic PM2.5 mass concentration monitoring.
In the light scattering method, particulate matter scatters light. The scattered light pulse is focused by a reflector and detected by a sensor positioned at a specific angle relative to the laser direction. The particulate matter mass concentration is calculated from the number and intensity of the detected light pulses. The light scattering method is an indirect measurement technique, with most instruments employing this method being portable. While the light scattering method is cost-effective, its accuracy is sensitive to environmental factors. Mitigating these factors and improving measurement accuracy could address the issue of inaccurate readings in civilian-level PM2.5 sensors commonly used for indoor air quality monitoring.
Table 1 presents a summary of the PM2.5 measurement standards issued by China’s Ministry of Environmental Protection and the China Meteorological Administration. These standards include the gravimetric method, beta-ray absorption method, micro-oscillating balance method, and light scattering method. Among these, the gravimetric, beta-ray absorption, and micro-oscillating balance methods are recognized by the Ministry of Environmental Protection, while the China Meteorological Administration specifies the light scattering method in the QX/T173-2012 standard. The beta-ray absorption, micro-oscillating balance, and light scattering methods are continuous automatic monitoring techniques, whereas the gravimetric method is manual and traditional, which led to its early implementation.
Furthermore, the "Technical Indicators and Requirements for PM2.5 Automatic Monitoring Instruments (Trial)," published by the China National Environmental Monitoring Center on June 9, 2013, outlines three automatic monitoring methods for PM2.5:
- Beta-ray method with dynamic heating system
- Beta-ray method with dynamic heating system combined with light scattering method
- Micro-oscillating balance method with a film dynamic measurement system
The beta-ray absorption and micro-oscillating balance methods are widely recognized as the most reliable among continuous automatic monitoring techniques. The micro-oscillating balance method is the most accurate, whereas the light scattering method is less widely accepted due to its sensitivity to environmental factors.
Table 1 Domestic PM2.5 measurement standards
|
Standard Number |
Standard Name |
Issuing Department |
Implementation Date |
Status |
Measurement Method |
|
HJ618-2011 |
Gravimetric Method for Determining Ambient Air PM10 and PM2.5 |
Ministry of Environmental Protection of China |
2011/11/1 |
Current |
Gravimetric method |
|
HJ656-2013 |
Technical Specifications for Manual Monitoring of Ambient Air Particulate Matter (PM2.5) using Gravimetric Method |
Ministry of Environmental Protection of China |
2013/8/1 |
Current |
|
|
HJ653-2013 |
Technical Requirements and Detection Methods for Continuous Automatic Monitoring Systems of Ambient Air Particulate Matter (PM10 and PM2.5) |
Ministry of Environmental Protection of China |
2013/8/1 |
Current |
B-ray absorption method or microbalance oscillation method |
|
HJ655-2013 |
Technical Specifications for Installation and Acceptance of Continuous Automatic Monitoring Systems of Ambient Air Particulate Matter (PM10 and PM2.5) |
Ministry of Environmental Protection of China |
2013/8/1 |
Current |
|
|
QX/T173-2012 |
GRIMM180 Method for Measuring PM10, PM2.5, and PM1 |
China Meteorological Administration |
2013/3/1 |
Current |
Laser radiation method |
The light scattering method is less widely accepted due to its high sensitivity to environmental factors, particularly humidity. The GRIMM180, which employs this method as specified in the QX/T173-2012 standard, has received international certification and is recognized as a reference standard by the China Meteorological Administration. The key factors contributing to measurement inaccuracies are outlined below:
- The instrument is equipped with temperature and humidity sensors, and dehumidification devices, to reduce the influence of environmental conditions.
- The equipment requires routine maintenance, including cleaning the sampling tube, air inlet cover, and filter every three months, to prevent errors caused by contamination.
When environmental factors are properly controlled, the light scattering method can provide accurate PM2.5 measurements.
A continuous online PM2.5 monitoring device was developed using the PMS3003 laser sensor as the test sensor, with calibration based on a reference standard. The device collected data on ambient temperature, humidity, and PM2.5 mass concentration, with a 1-minute sampling interval. The device transmits measurement results to the cloud via Wi-Fi, leveraging Internet of Things (IoT) technology and cloud platform services. The platform records the data, including sensor readings and timestamps, which are stored in a database and analyzed using data processing software. The PMS3003 sensor and the reference instrument, GDEMC, were positioned in the same environment, free from any nearby pollution sources that could affect the measurements. Data analysis was performed over two consecutive weeks, producing the time series diagram of PM2.5 concentration shown in Figure 1.
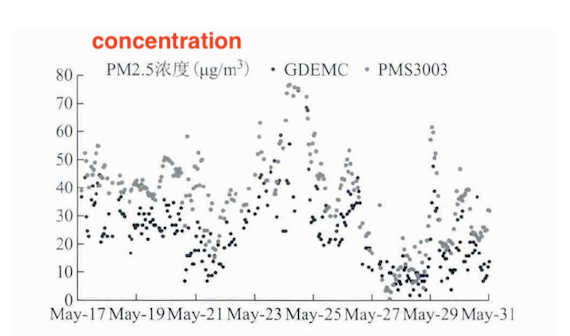
Figure 1: PM2.5 concentration time series of PM3003 and GDEMC
The average values, standard deviations, mean deviations, mean deviation ratios, and root mean square errors were calculated for both the PMS3003 and GDEMC. The results are presented in Table 2. The time series diagram shows that the PMS3003 generally reports higher values than the GDEMC. The statistical analysis showed that the average value for PMS3003 was 36.489, compared to 23.924 for GDEMC. The mean deviation value was 12.565, with a mean deviation ratio of +53%.
The QX/T173-2012 standard specifies that the deviation in PM2.5 concentration measurements should not exceed 10%. However, the mean deviation ratio of the PMS3003 compared with the GDEMC was +53%, significantly exceeding this threshold. Consequently, the PMS3003 sensor output contains significant errors and does not accurately reflect the true PM2.5 concentration.
Table 2: Mean and Deviation Statistics
|
PM2.5 (N=263, 2 weeks) |
GDEMC |
PMS3003 (Direct Measurement) |
|
Average Value (µg/m³) |
23.924 |
36.489 |
|
Standard Deviation (µg/m³) |
12.383 |
15.301 |
|
Mean Deviation (µg/m³) |
- |
+12.565 |
|
Mean Deviation Ratio (%) |
- |
+53% |
|
Root Mean Square Error (µg/m³) |
- |
15.846 |
This study analyzes the relationship between the PMS3003 sensor and the GDEMC reference instrument. The data from the PMS3003, measured at the same time points, are denoted as y, while the GDEMC data are denoted as x. This results in a set of paired data points: (x₁, y₁), (x₂, y₂), ..., (xm, ymₘ), where m represents the total number of data points. These data points are plotted on a scatter plot. If the points align closely with a straight line, the line is considered the best fit, and the least squares method is applied to calculate the regression coefficients. Figure 2 presents the hourly scatter plot for comparison. The purple and black lines denote the least squares fitting lines derived from the slope-intercept equation (y = mx + c). The purple line is fitted without an intercept, while the black line includes an intercept. The red line represents the identity line, where y = x.
As shown in Figure 2, the data points generally lie above the y = x line, indicating that the PMS3003 typically reports higher values than the GDEMC. A consistent deviation between the two instruments is observed, accompanied by a strong linear correlation. The goodness-of-fit is assessed using the coefficient of determination (R²). R² ranges from 0 to 1, with values closer to 1 indicating a better fit between the regression line and the observed data. The black line shows an R² value of 0.6015 for the PMS3003 and GDEMC data, while the red line shows an R² value of 0.4354, indicating that the black line provides a better fit. However, an R² value of 0.6015 is suboptimal, suggesting that further improvements in the fit could be achieved by segmenting the data intervals and refining the analysis.
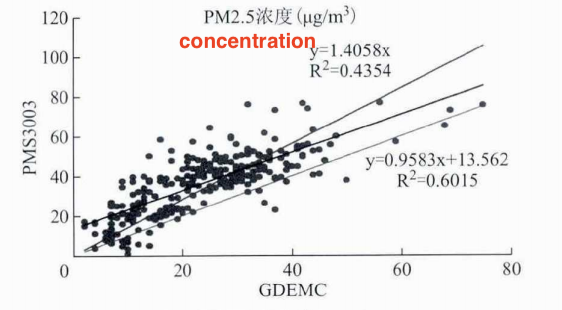
Figure 2: Fitting curve of sampling data
The slope and intercept of the fitting curve in Figure 2 are constants, but this curve may not hold universally. Based on the sampling data, the slope was found to correlate with the humidity level. Humidity significantly influences the extinction coefficient in light scattering sensors, suggesting that further investigation into the impact of humidity on PMS3003 measurements could yield a more accurate fitting curve.
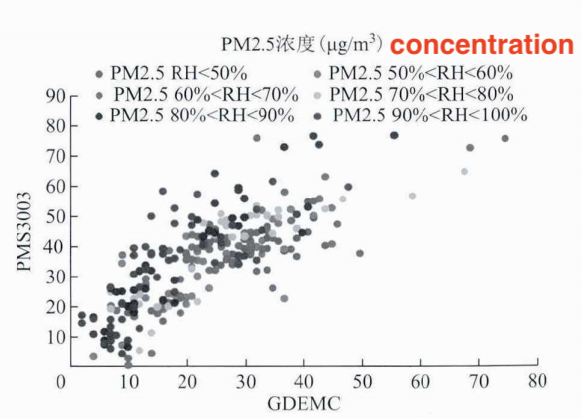
Figure 3: Corresponding relationship between PM2.5 concentration and humidity (different colors represent different humidity ranges)
Figure 3 divides humidity into several intervals, with the corresponding PM2.5 concentration values for each interval indicated by different colors. A linear relationship is evident in each color-coded scatter plot. The slope of the fitting curve varies with humidity levels. To systematically analyze this relationship, Table 2 shows the optimal slope for the GDEMC values (x) and PMS3003 values (y) at various relative humidity (RH) levels. The results in Table 2 indicate that, to achieve an ideal fit, the slope of the fitting line must adjust according to relative humidity, with lower humidity resulting in a steeper slope.
Table 3: Optimal Slope of PM2.5 Concentration at Different RH
|
Humidity Range (RH) |
Number (N) |
RH Median (%) |
RH Average (%) |
Optimal Slope |
|
0% ≤ RH < 50% |
36 |
44.159 |
43.612 |
0.864 |
|
50% ≤ RH < 60% |
29 |
55.103 |
55.398 |
0.730 |
|
60% ≤ RH < 70% |
66 |
64.808 |
64.787 |
0.650 |
|
70% < RH < 80% |
34 |
73.319 |
74.037 |
0.692 |
|
80% ≤ RH < 90% |
40 |
86.754 |
85.388 |
0.548 |
|
90% ≤ RH ≤ 100% |
58 |
91.386 |
91.341 |
0.518 |
The slope is a linear function of relative humidity (RH). Based on the paired data between humidity and slope presented in the table, the relationship between the slope and humidity is given by the equation:
K = -0.66 × RH / 100 + 1.1267
The slope from the previous section is used to derive the calibration equation:
Calibration Value = Measured Value × (-0.66 × RH / 100 + 1.1267)
To assess calibration effectiveness, the same sample set used in Figure 1 was used. Figure 4 shows the time series of PM2.5 concentrations post-calibration. As illustrated, the calibrated values align closely with the standard values. To assess the consistency between calibrated and standard values, the mean and deviation of the calibrated PM2.5 concentrations were analyzed, as shown in Table 3. The results in Table 3 show that the mean deviation of the calibrated PM2.5 values is -0.775 µg/m³, with a mean deviation ratio of -3%, a significant reduction from the uncalibrated values. Additionally, the calibrated PM2.5 concentrations were compared to GDEMC data, as shown in Figure 5.
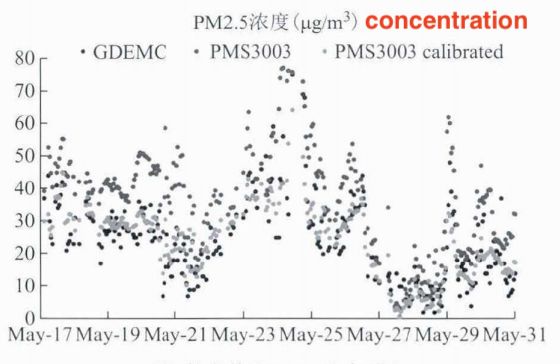
Figure 4: Comparison of PM2.5 concentration before and after calibration
Table 4 Comparison of mean and error statistics before and after calibration
|
PM2.5 (N=263, 2 weeks) |
GDEMC |
PMS3003 (Before Calibration) |
PMS3003 (After Calibration) |
|
Mean Value (µg/m³) |
23.924 |
36.489 |
23.149 |
|
Standard Deviation (µg/m³) |
12.383 |
15.301 |
10.514 |
|
Mean Deviation (µg/m³) |
/ |
+12.565 |
-0.775 |
|
Mean Deviation Ratio (%) |
/ |
+53% |
-3% |
|
Root Mean Square Error (µg/m³) |
/ |
15.846 |
6.559 |
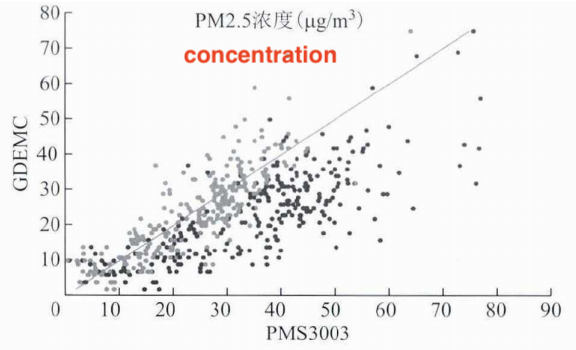
Figure 5: Comparison of Consistency Between the Original and Calibration Values of PMS3003
Figure 5 presents a comparison of the consistency between the original and calibrated PMS3003 sensor values. As shown, the calibrated data points are closely clustered around the y=x line, indicating that the calibrated values align more closely with the standard values. The correlation between humidity and the measurements is confirmed using data from additional time points. The results show that adjusting PM2.5 concentration readings based on humidity can reduce the measurement deviation to less than 15%.
PM2.5 measurements using laser scattering may experience significant errors due to the influence of environmental humidity. To explore the relationship between humidity and measurement accuracy, extensive data from both PM2.5 sensors and benchmark instruments were collected. The correlation between the sensor readings and benchmark measurements was analyzed, leading to the development of a calibration equation. Testing revealed a substantial reduction in measurement deviation after calibration. Initially, the deviation was 53%, but after calibration, it was reduced to less than 15%, greatly enhancing the laser sensor's accuracy.
However, the calibration data have certain limitations. It reflects conditions specific to the equipment's location, and environmental factors like air pollution composition, concentration, and humidity vary by location. Moreover, air pollution is seasonal, and since the sampling period was limited to two weeks, the data may not reflect long-term trends. Thus, broader data collection across different periods and regions is recommended. Additionally, the findings are specific to the sensor model tested. The results may not apply to other sensors using the laser scattering method, as this depends on the sensor's design and calculation methodology, which requires further investigation.
Previous: Automotive PM2.5 Sensor: Ensuring Clean Air Inside Your Vehicle
Next: Volatile Organic Compounds (VOCs) and Indoor Air Quality


